| variable | duration | Description | horizon | Latency |
|---|---|---|---|---|
| chla | P1D | daily mean Chlorophyll-a (ug/L) | 30 days | ~ 0 days |
tl;dr: Forecast the targets!
The “targets” are time-series of United States Geological Survey (USGS) and California Department of Water Resources (CA DWR) data for use in model development and forecast evaluation.
The targets are updated as new USGS and CA DWR data are made available.
This challenge focuses on forecasting river chlorophyll-a at select monitoring locations. Ten sites are USGS stations, and five sites in the Sacramento–San Joaquin Delta are contributed by the CA DWR. See Data sources and quality below for how those data are assembled and quality-controlled. The links to targets files are included below.
Where to start
As you develop your forecasting skills and want to expand to more sites, the targets are available at all 15 sites (10 USGS sites and 5 CA DWR Delta sites). You may also consider submitting forecasts to sites that match your interests or locality.
More information about the sites can be found in the site metadata and on USGS and CA DWR websites.
Explore the targets and themes
Information on the targets files for the river chlorophyll challenge is below. In the tables,
“duration” is the time-step of the variable where
P1Dis a daily mean.The “forecast horizon” is the number of days-ahead that we want you to forecast.
The “latency” is the time between data collection and data availability in the targets file
River Chlorophyll

The river chlorophyll challenge invites you to forecast daily mean chlorophyll at up to 15 river sites — 10 USGS sites and 5 CA DWR sites in the Sacramento–San Joaquin Delta.
The daily mean target file is located at the following URL.
url <- "https://sdsc.osn.xsede.org/bio230014-bucket01/challenges/targets/project_id=usgsrc4cast/duration=P1D/river-chl-targets.csv.gz"You can directly load it into memory for R
aquatics_targets <- readr::read_csv(url, show_col_types = FALSE)or python
import pandas as pd

url = "https://sdsc.osn.xsede.org/bio230014-bucket01/challenges/targets/project_id=usgsrc4cast/duration=P1D/river-chl-targets.csv.gz"
aquatics_targets = pd.read_csv(url)
The file contains the following columns
| project_id | site_id | datetime | duration | variable | observation |
|---|---|---|---|---|---|
| usgsrc4cast | DWR-GLE | 2013-02-26 | P1D | chla | 4.195833 |
| usgsrc4cast | DWR-GLE | 2013-02-27 | P1D | chla | 4.491667 |
| usgsrc4cast | DWR-GLE | 2013-02-28 | P1D | chla | 4.163542 |
| usgsrc4cast | DWR-GLE | 2013-03-01 | P1D | chla | 4.120833 |
| usgsrc4cast | DWR-GLE | 2013-03-02 | P1D | chla | 4.129167 |
| usgsrc4cast | DWR-GLE | 2013-03-03 | P1D | chla | 4.040625 |
and the time series for the focal sites
aquatics_targets |>
  filter(site_id %in% aquatics_focal_sites) |>
  ggplot(aes(x = datetime, y = observation)) +
  geom_point() +
  facet_wrap(~site_id, scales = "free") +
  theme_bw() +
  ylab("Chlorophyll-a (ug/L)")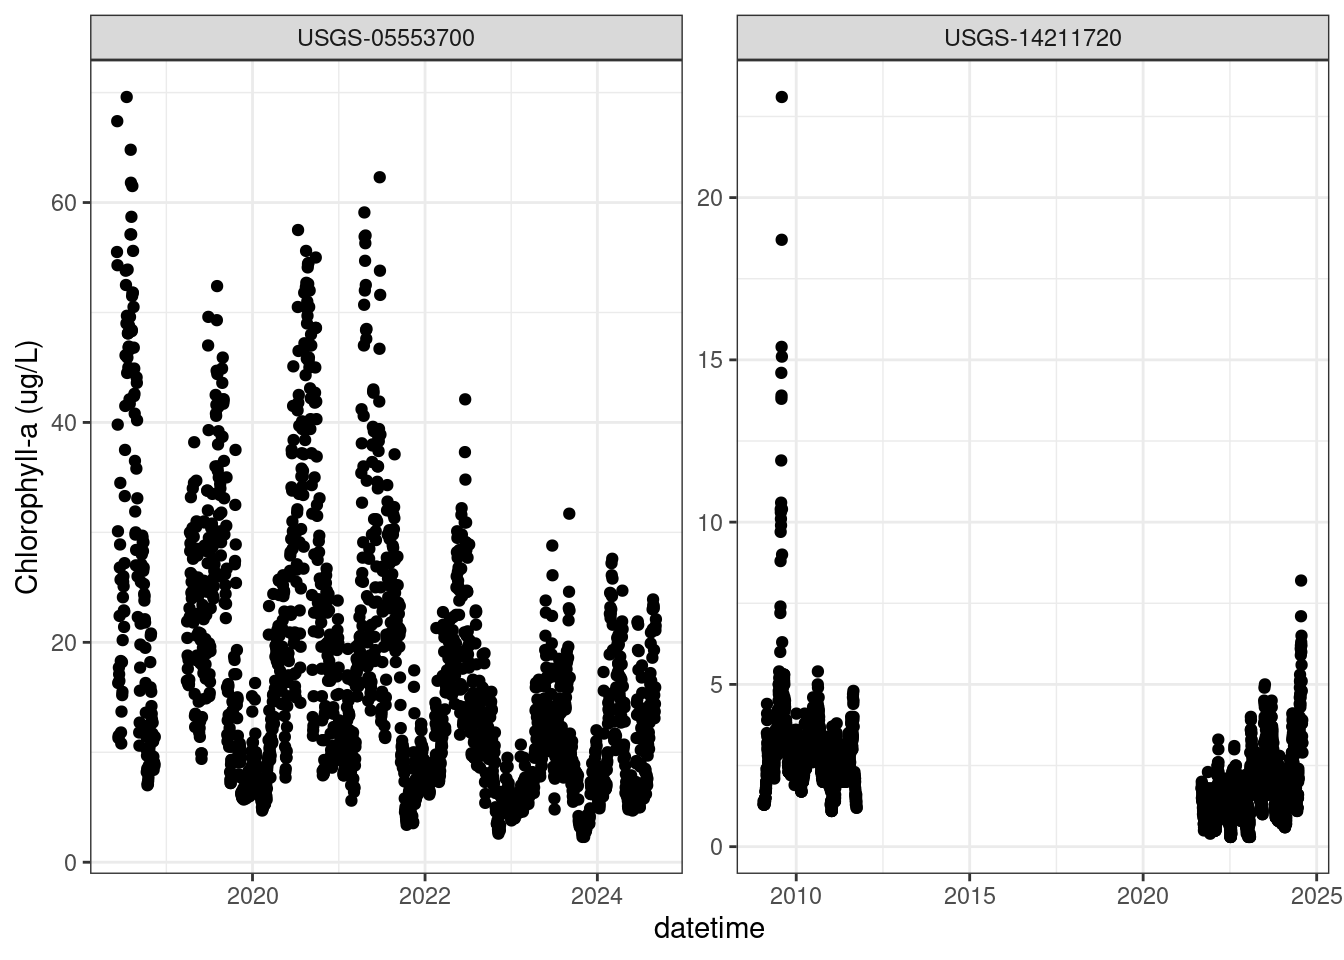
Explore the sites
The following table lists all the sites in the EFI-USGS Ecological Forecasting Challenge.
| site_id | agency | site_no | station_nm | site_url |
|---|---|---|---|---|
| USGS-14211720 | USGS | 14211720 | WILLAMETTE RIVER AT PORTLAND, OR | https://waterdata.usgs.gov/monitoring-location/14211720 |
| USGS-14211010 | USGS | 14211010 | CLACKAMAS RIVER NEAR OREGON CITY, OR | https://waterdata.usgs.gov/monitoring-location/14211010 |
| USGS-14181500 | USGS | 14181500 | NORTH SANTIAM RIVER AT NIAGARA, OR | https://waterdata.usgs.gov/monitoring-location/14181500 |
| USGS-05586300 | USGS | 05586300 | ILLINOIS RIVER AT FLORENCE, IL | https://waterdata.usgs.gov/monitoring-location/05586300 |
| USGS-05558300 | USGS | 05558300 | ILLINOIS RIVER AT HENRY, IL | https://waterdata.usgs.gov/monitoring-location/05558300 |
| USGS-05553700 | USGS | 05553700 | ILLINOIS RIVER AT STARVED ROCK, IL | https://waterdata.usgs.gov/monitoring-location/05553700 |
| USGS-05543010 | USGS | 05543010 | ILLINOIS RIVER AT SENECA, IL | https://waterdata.usgs.gov/monitoring-location/05543010 |
| USGS-05549500 | USGS | 05549500 | FOX RIVER NEAR MCHENRY, IL | https://waterdata.usgs.gov/monitoring-location/05549500 |
| USGS-01427510 | USGS | 01427510 | DELAWARE RIVER AT CALLICOON NY | https://waterdata.usgs.gov/monitoring-location/01427510 |
| USGS-01463500 | USGS | 01463500 | Delaware River at Trenton NJ | https://waterdata.usgs.gov/monitoring-location/01463500 |
| DWR-SJR | CA DWR | SJR | San Joaquin River Near Vernalis | https://cdec.water.ca.gov/dynamicapp/staMeta?station_id=SJR |
| DWR-MLS | CA DWR | MLS | McLeod Lake at Stockton | https://cdec.water.ca.gov/dynamicapp/staMeta?station_id=MLS |
| DWR-GLE | CA DWR | GLE | Grant Line Canal East | https://cdec.water.ca.gov/dynamicapp/staMeta?station_id=GLE |
| DWR-MHO | CA DWR | MHO | Middle River At Howard Road | https://cdec.water.ca.gov/dynamicapp/staMeta?station_id=MHO |
| DWR-OH1 | CA DWR | OH1 | Old River Near Head | https://cdec.water.ca.gov/dynamicapp/staMeta?station_id=OH1 |
Data sources and quality
Target chlorophyll-a observations come from two agencies, and the data pass through different levels of quality assurance depending on the source. When more than one source reports a value for the same site and day, the challenge keeps the value from the highest-quality source available.
USGS sites (10 sites)
Observations are pulled from the USGS National Water Information System (NWIS) and updated as new data are released. See the USGS Water Data dashboard for the underlying station data.
CA DWR Delta sites (5 sites)
The five Sacramento–San Joaquin Delta sites (DWR-SJR, DWR-MLS, DWR-GLE, DWR-MHO, DWR-OH1) are monitored by the California Department of Water Resources. Their chlorophyll-a data are assembled from up to three sources, in decreasing order of data quality:
| Source | Quality | Update cadence | Role in the target record |
|---|---|---|---|
| EDI data releases | Reviewed / QA-QC’d | ~annual | Authoritative historical record; failed-QA values are set to NA by the data publisher. Feeds the long baseline used by climatology models. |
| Water Data Library (WDL/CNRA) | Reviewed / QA-QC’d | ~every 2 months | Extends the reviewed record past the latest EDI revision; pulled by a recurring quarterly backfill that replaces provisional CDEC values wherever WDL has coverage. |
| CDEC real-time telemetry | Not QA-QC’d (provisional) | daily | Keeps the most recent days current for scoring; may contain gaps or outliers until EDI/WDL catch up. |
What is and isn’t quality-controlled: the historical record for these sites (roughly 2005–2025, depending on station) comes from the QA-QC’d EDI data releases published by CA DWR, extended by reviewed WDL data where WDL has published past the latest EDI revision. Only the days more recent than the latest reviewed (EDI or WDL) values come from CDEC real-time telemetry, which is provisional and not quality-controlled. Those recent values are used so forecasts can be scored promptly, and are progressively replaced by reviewed values as CA DWR publishes them, first through the quarterly WDL backfill, then through subsequent EDI releases.
EDI data releases used:
- NCRO continuous water quality (
DWR-GLE,DWR-MHO,DWR-OH1):edi.2180.2 - EMP (
DWR-SJR):edi.1177.8
DWR-MLS (McLeod Lake, Stockton) was installed in 2024 and is not yet in an EDI release, but reviewed WDL data are now available for it, so its record is a mix of reviewed WDL values and provisional CDEC values (rather than CDEC-only) until it appears in an EDI release.